


WND MONEY
OBAMA'S LATEST FRAUD: 'ECONOMIC RECOVERY' DISPROVEN IN JUST 9 CHARTS
Numbers demonstrate failure of administration's policies
Jerome R. Corsi
NEW YORK – The Federal Reserve Bank of St. Louis updates quarterly a set of nine easy-to-understand charts that demonstrate how Obamanomics, the economic policies of the Obama administration, have failed to produce real economic benefits for the American people.
The nine charts illustrate that Obamanomics has dramatically increased both consumer and government debt; driven U.S. workers out of the labor force in a manipulation of statistics designed to allow the Bureau of Labor Services to report an unemployment rate that is artificially low; increased health-care costs despite the passage of the Affordable Care Act; and produced a questionable economic recovery, with U.S. growth rates still hovering at near-recession levels of economic stagnation.
This article is an update of a report published by Rachel Stoltzfoos, “Obama’s Economy in 9 Charts,” in the Daily Caller on Oct. 30, 2015. In September 2015, ZeroHedge.com introduced the concept of selecting nine charts to describe the Obama economy from the dozens of charts produced and updated by the Federal Reserve Bank of St. Louis.
Student loans
The first chart tracks student loans, making it clear that as of the third quarter 1990, there were no outstanding student loans. At the beginning of the Obama administration, in the first quarter of 2009, student loans stood at $146.6 billion. From there, the graph rises steeply. By the fourth quarter 2015, the last quarter for which the Federal Reserve Bank of St. Louis charted the data, student loans had risen to $945.6 billion.

The origin of the student loan program can be traced to Bill Clinton signing the Omnibus Reconciliation Act of 1993, which set up a phase-in of a direct government lending for student loans that replaced the program of government guarantees of private student loans arranged largely through banks, beginning with the National Defense Education Act of 1958 and the Federal Family Education Loan Program in 1965.
In signing the Health Care and Education Reconciliation Act of 2010, President Obama engineered a government takeover of the student loan program, so that today all student loans are direct government loans.
Food stamps
Under President Obama, the Supplemental Nutrition Assistance Program, or SNAP, commonly known as the “Food Stamps” program, has grown from $54.8 billion in 2009 to $69.4 billion in 2014.

In January 2015, the number of beneficiaries receiving food stamps topped 46 million for 38 straight months, with 14.6 percent of the population and 19.7 percent of all households receiving food stamps. This represents an increase of 1516.96 percent over the 2.9 million Americans participating in the food stamp program in 1969.
Federal debt
The federal debt is projected to nearly double under President Obama, with the Federal Reserve Bank of St. Louis chart showing it has increased from $11.1 trillion in the first quarter 2009 to $18.9 trillion in the fourth quarter 2015.

At the end of the George W. Bush presidency in January 2009, the federal debt stood at $10.6 trillion. It is projected to exceed $20 trillion by the end of Obama’s presidency in January 2017.
Money printing
While Quantitative Easing, the Federal Reserve policy of printing money to buy U.S. Treasury Department-issued government debt, known among economists as QE, began under President George W. Bush, it took off under President Obama.
The Federal Reserve Bank of St. Louis chart shows the adjusted monetary base of the United States rose from $1.772 trillion on Jan. 14, 2009, to $3.996 trillion as of March 16, 2016.

As WND reported in April 2014, the Federal Reserve in the Obama administration pumped the Federal Reserve’s balance sheet with more than $4 trillion of purchases of U.S. Treasuries and other federal government bonds. QE grew to a level of $85 billion a month under the previous Federal Reserve chairman, Ben Bernanke.
Health insurance costs
Despite Obama’s promises that the implementation of Obamacare would lower health-care costs, the Federal Reserve Bank of St. Louis chart shows the Consumer Price Index, CPI, for medical care services has continued a straight-line increase since the passage of the Affordable Care Act.
0321econ5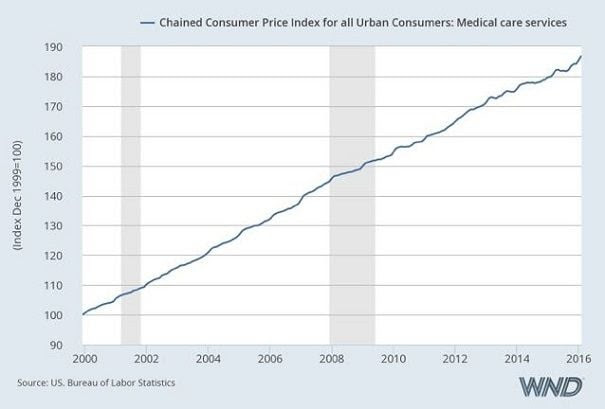
The CPI for medical care services has increased from 149.952 in January 2009 to 186.961 in February 2016, rising from a base of 100 in December 1999.
Labor-force participation
The labor-force participation rate has fallen consistently under the Obama administration as an increasing percentage of those out of work and looking for work simply give up and quit looking. The labor-force participation rate has dropped from 65.7 percent in January 2009 to 62.9 percent in February 2016.

In May 2014, WND reported that the Bureau of Labor Administration in the Obama administration had implemented a policy of making unemployment percentages look artificially low by increasing the number of workers considered no longer in the work force.
In April 2014, nearly 93 million Americans were considered out of the labor force. According to John Williams, an economist known for arguing the government reports manipulate “shadow statistics” of economic data for political purposes, drops in the unemployment rate as reported by the BLS have become virtually meaningless.
“The broad economic outlook has not changed, despite the heavily-distorted numbers that continue to be published by the BLS,” Williams writes in his subscription newsletter on ShadowStats.com. “The unemployment rates have not dropped from peak levels due to a surge in hiring; instead, they generally have dropped because of discouraged workers being eliminated from headline labor-force accounting.”
Business workforce share of income
The Bureau of Labor statistics measures labor’s share of the income produced by nonfarm employment, roughly described as employment in the business sector of the economy. The measure is often used to interpret “the worker’s share of the economy,” with a declining index interpreted as a measure of growing economic discontent among middle class employees.

The index has dropped from a peak of 103.605 in the first quarter 2007, under President George W. Bush, to 99.350 in the fourth quarter 2015, under President Obama.
Median family income
Real median household income in the United States has declined from a height of $57,357 in 2007 under President George W. Bush to $53,657 in 2014 under President Obama.

The calculation takes into consideration the “Obama economic recovery,” in that real median household income in the United States by 2013 rose to $54,426 in 2013, from a low of $52,605 in 2012, only to fall back again in 2014.
Home-ownership rate
Home ownership under Obamanomics has continued a straight-line decline that began with the collapse of the substandard real estate market during George W. Bush’s second term in office.

The home-ownership rate has declined from 67.4 percent in 2009 to 63.7 in the second quarter 2015. On July 28, 2015, the Wall Street Journal reported that the rate of home ownership in the second quarter 2015 hit a 48-year low, reflecting the reality that fewer middle class Americans can afford to buy a home. Under Obama, an increasing number of Americans are living in rented homes, with the American dream of owning a home no longer an economic reality.
Read more at http://www.wnd.com/2016/03/obamas-economic-recovery-in-just-9-charts/#Ev0ld0eJKOG86axG.99My comments: America is going to Hell in a Hand Basket. The Curse of Deuteronomy 28 is upon her and she is being Ground to Powder. She has Abandoned her Faith in God and His Word and this is the Result.
No comments:
Post a Comment